
Search the knowledge base, browse our resources, and visit our Community Forum for more detailed information
Last updated: 5 Jun 2026
KoboToolbox allows you to collect repeated data within a form, for example, when conducting a household survey where all members are asked the same questions. This article explains how to view, edit, and export repeat group data, and how to link repeat group data to the main data.
To learn more about setting up repeat groups in your forms, see Groups and repeat groups in the Formbuilder and Repeat groups in XLSForm.
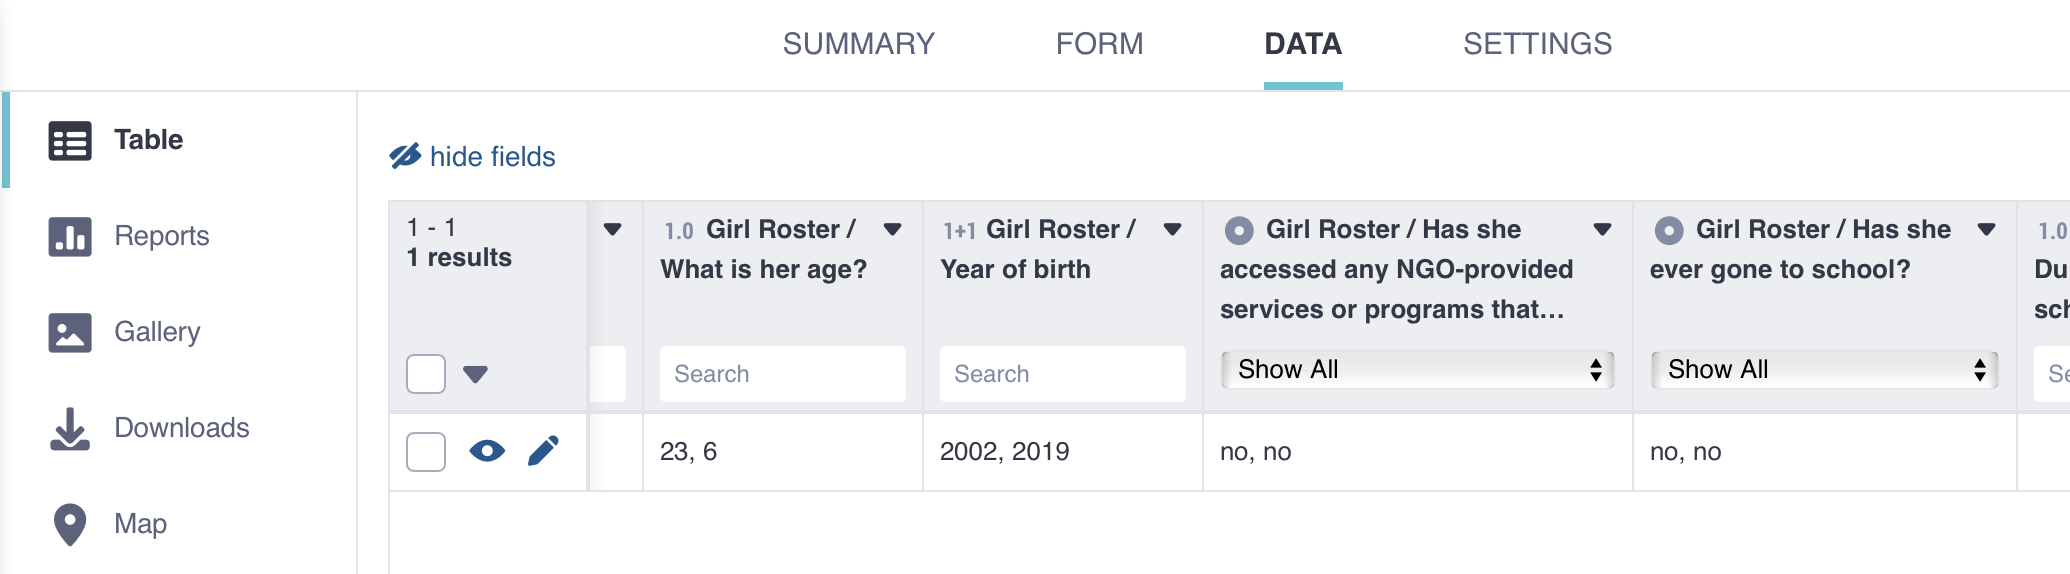
You can view repeated data in the data table, which you can find in the Table view of the DATA tab in the KoboToolbox project interface. Responses to repeated questions appear in a single column per question, with responses separated by a comma, as shown below.
You can also view the complete data for any given submission, including each repetition of repeat groups, by clicking the Open button to the left of each submission.
To edit repeat group data, click the Edit button. This will open up the form and allow you to edit the form data before resubmitting. Bulk editing repeat group data is not currently supported.
Note: Repeat group data cannot be displayed in the Reports or Map views due to the data structure of repeat groups.
To export data from a form with repeat groups, you must download your data in XLS format. Each repeat group will be exported as a separate sheet in the exported file. CSV download will only provide data from the primary data.
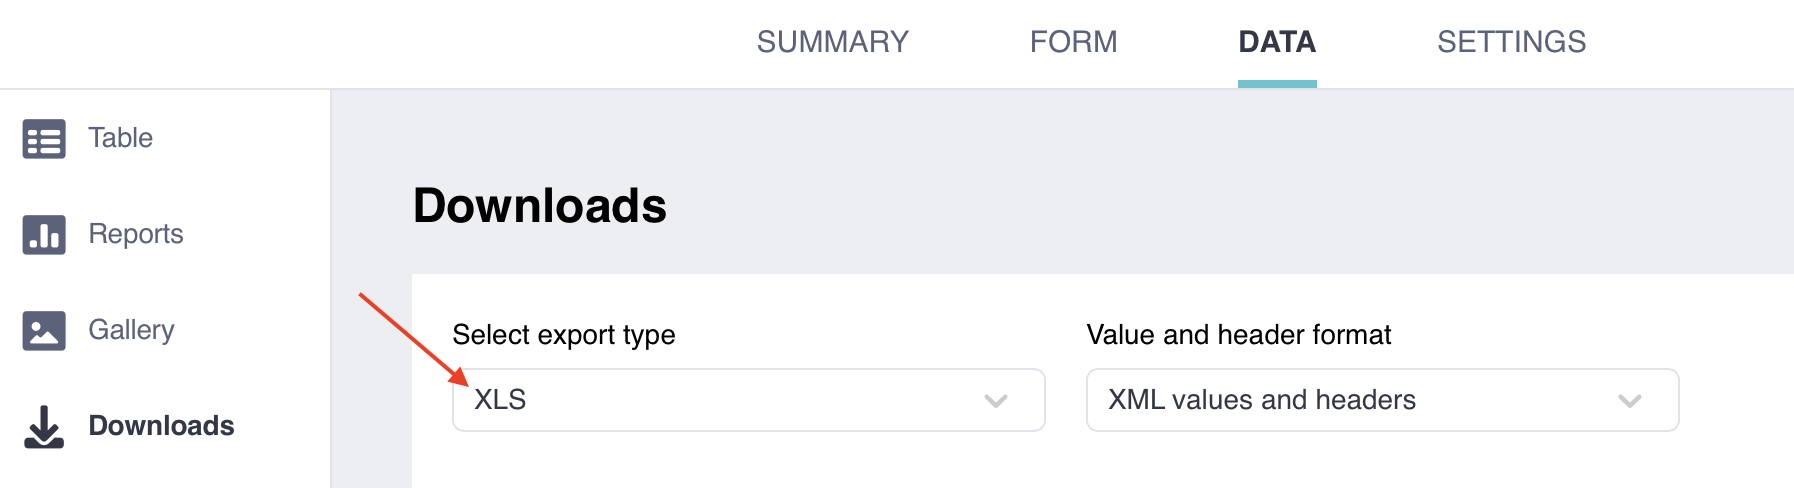
To learn more about exporting your data, see Exporting and downloading your data.
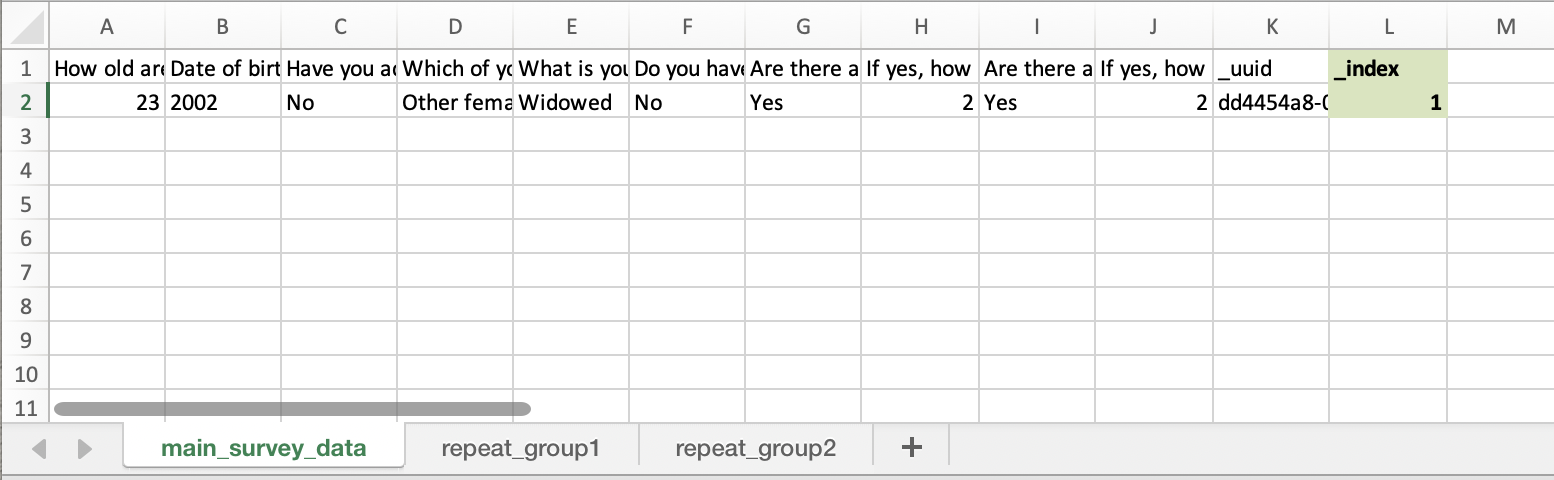
In exported XLS files, repeat group data is stored in a separate sheet. The first sheet of the XLS file contains the main response data, and each repeat group’s data is stored in its own sheet. Nested repeat groups are also stored in separate sheets.
Data from repeat groups can be linked to the main data using the _index column from the main data sheet and the _parent_index column from the repeat group data sheet.
In the example below, the first sheet includes an _index column, in green, which identifies the first submission. The second sheet, shown in the second image, contains a _parent_index column, also highlighted in green, which links back to the first sheet. In this example, both rows from the repeated data come from the first data submission.
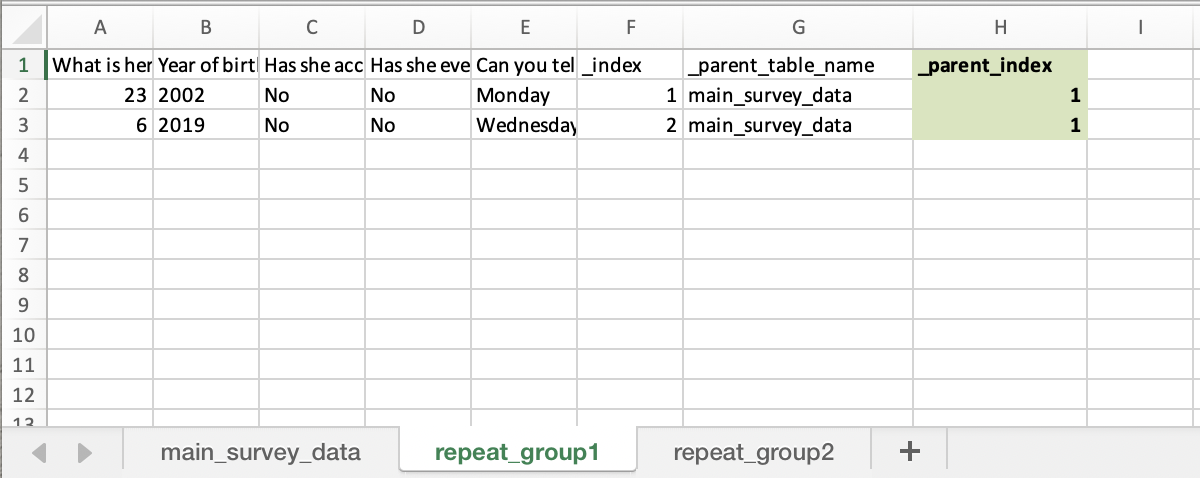
Note: The repeat group data sheet also includes an _index column. This column is used to link to nested repeat groups, following the same setup as described above, with the repeat group as the main data and the nested repeat group as the linked data.
Repeat group data can be merged with the main data using different tools for data analysis. For example, in Excel and Power BI, you can use Power Query or VLOOKUP() to merge data. In SQL, R, SAS, and other database management languages, you can combine the datasets using a left join.
To learn more about merging repeat group data using Power Query, see Merging Individual Data with Roster Data through Power Query in Excel.
To learn more about combining datasets in R, see Mutating joins.
Did you find what you were looking for? Was the information clear? Was anything missing?
Share your feedback to help us improve this article!